
How to Pass the Databricks Spark Exam and Cheatsheets
After a few Guinness there is nothing I like better than to do a certification. In this instance it was the databricks spark developer associate certification. It took me about 2 weeks from deciding to do it to passing as I was already well versed in spark. This is how I did it!
Pre-Requisites
- Github Account - I used this to clone my own versions of the courses into and work along my own copies of the code.
- You’ll need some platform to run databricks notebooks. I used my own Azure databricks workspace which I setup as per my last blog post (but you can just create manually), but even easier if you just want to pass the exam would be to use Databricks Community Edition, which is all ready to go!
Useful Links
- Practice Exam - Here’s a link to the official practice exam pdf. I had a quick whizz through this before going through the material below, but 2 days before the exam I sat down and did it properly with a pen and paper. I went through the exam and checked my marks, I found would have passed so felt confident going in!
- Databricks Academy - Sign up to this learning resource which is absolutely free. I actually did the lakehouse fundamentals course first (about 2 hours with speed ramped up) and then spark associate pathway which I think took me about 11 hours with speed ramped up. This pathway also covers “just enough python for spark” too which was a great refresher, but not really needed for the exam.
- Databricks Academy Github - The repos I forked into my own github repository, then add as repos to my databricks workspace, and worked along with are:
- Databricks Community Edition - This is a great free resource for utilising a free Databricks workspace for any training you might have.
- Super Useful Spark Tutorial Notebook - Found this somewhere and found it a absolutely great thing to run through for a reminder of all things spark!
- Kryterion Certification Login - This is where you can book your exam. I booked it within a fortnight of deciding to do it and prior to looking at any materials as I was pretty comfortable with most of the spark basics. My advice is always book the exam for as soon as possible so you don’t drag it out, usually within 30 days regardless of current level. Commit and go for it! The exam costs $200 which was about £190 when I paid for it.
- Advancing Analytics YouTube Channel - No you don’t have to watch the whole channel for the exam but I recommend subscribing, and I did watch these three videos a couple of days before the exams on top speed!
AND…
Its worth knowing that databricks comes with a host of built-in datasets for you to mess around with. This might help you explore different types of data and practice with them as you see fit. The code I show in the rest of the blog uses a super simple dataframe we create so its all self-contained, but you could use any of the ones found here too.
%py
display(dbutils.fs.ls("/databricks-datasets"))
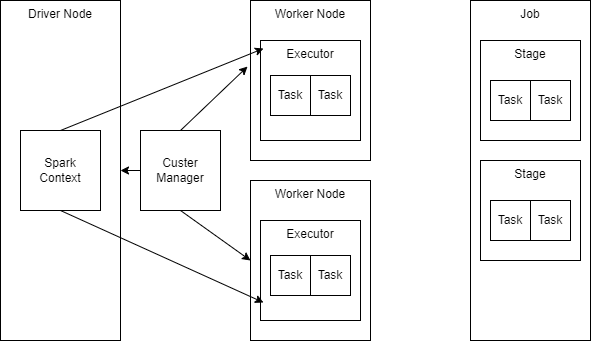
Spark Architecture
Diagram
There are far better diagrams out there such as this one so this is simply to keep everything in one place!
- The cluster has a driver node which controls the spark application and coordinates the worker nodes.
- When an action is perform a job occurs which is made up of stages and then tasks.
Terms
- Deployment Mode - Cluster and Client modes.
- Driver Node: This node coordinates the spark application and gives the work to the worker nodes.
- Worker Node: These nodes carry out the processing that is required.
- Executor: This is a process that runs on a worker node that carries out a task.
- Slot: A slot is the name databricks give for the available threads to do work in parallel in spark.
- Shuffle: A shuffle is when data needs to be redistributed across the cluster. This is an expensive operation.
- Transformation: Transformations are lazily executed and just provide the logic to create a dataframe without actually doing anything until an action is called. Transformations include filter, select, union, sample and cache.
- Action: An action actually performs some data processing as a result of carrying out the logic provided by the transformations. Action commands include count, take, show, min, max and collect.
- Narrow Transformation: This is a data transformation that involves no shuffling as everything can happen on a single partition. These are less resource intensive and quicker than wide transformations. Narrow transformations include select, filter and union.
- Wide Transformation: This is a data transformation that involves shuffling across partitions. These are more resource intensive and slower than narrow transformations. Wide transformations include groupBy, join and sort.
- Job: A job is a result of an action being triggered and is made up of stages.
- Stage: A stage occurs when a shuffle needs to take place. A stage is made up of tasks.
- Task: This is the smallest unit of work in spark that goes to one executor.
- Broadcast Join: This is when spark broadcasts a smaller dataset across all executors and keeps them in memory so there is then no need to shuffle from the larger dataframe in the join as the data is present everywhere. This is often useful for reference data or lookup data.
Spark API Cheatsheet
This next session is as much syntax and content that I can muster… I recommend going through the courses and links mentioned above still, but the below should help by having enough reminders for any quick questions you want to lookup for the exam. If you want to actually run some of this code you can use the generate test data section below to create it. You can also use the cheatsheet notebooks found here in the hungovercoders cheatsheets to run the notebooks in databricks which also generates the test data to go with it.
Generate Test Data
First install the required packages.
pip install dbldatagen
pip install faker
Create some fake reference data for breweries.
brewery_beers = [
    "tinyrebel_staypuft",
    "tinyrebel_cwtch",
    "craftydevil_mikerayer",
    "craftydevil_mangowalk",
    "flowerhorn_yawn",
    "flowerhorn_mantis",
]

df_brewer = spark.createDataFrame([("Tiny Rebel", "Newport"), ("Crafty Devil", "Cardiff"), ("Flowerhorn", "Cardiff")], ["brewer", "location"])

brewer_metadata = {"description": "This is the name of the brewer of the beer."}
df_brewer = df_brewer.withMetadata("brewer", brewer_metadata)
location_metadata = {"description": "This is the location of the brewer."}
df_brewer = df_brewer.withMetadata("location", location_metadata)

print("Here is the metadata for the fields:")
for field in df_brewer.schema:
    print(field.name, field.dataType, field.metadata["description"])

display(df_brewer)
Then create the drinking data!
from datetime import timedelta, datetime
from pyspark.sql.functions import current_timestamp, current_date, lit
from pyspark.sql.types import (
    StructType,
    StructField,
    StringType,
    FloatType,
    TimestampType,
)
import dbldatagen as dg
from faker.providers.person.en import Provider

first_names = list(set(Provider.first_names))[0:1000]


interval = timedelta(days=1, hours=1)
end = datetime.now()
start = end - timedelta(30)

first_name_metadata = {"description": "The first name of the person who drank the beer"}
brewery_beer_metadata = {"description": "The brewer and beer that was drunk"}
quantity_pint_metadata = {"description": "The amount of beer that was drunk"}
timestamp_metadata = {"description": "Date and time beer was drank"}
last_updated_metadata = {"description": "The last date and time this row was updated"}

schema = StructType(
    [
        StructField("first_name", StringType(), True, metadata=first_name_metadata),
        StructField("brewery_beer", StringType(), True, metadata=brewery_beer_metadata),
        StructField(
            "quantity_pint", FloatType(), True, metadata=quantity_pint_metadata
        ),
        StructField("timestamp", TimestampType(), True, metadata=timestamp_metadata),
        StructField(
            "last_updated", TimestampType(), True, metadata=last_updated_metadata
        ),
    ]
)

beers_drank = (
    dg.DataGenerator(sparkSession=spark, name="beers_drank", rows=10000, partitions=10)
    .withSchema(schema)
    .withColumnSpec("first_name", "string", values=first_names)
    .withColumnSpec("brewery_beer", "string", values=brewery_beers)
    .withColumnSpec("quantity_pint", minValue=0.5, maxValue=1, step=0.5, random=True)
    .withColumnSpec(
        "timestamp", "timestamp", begin=start, end=end, interval=interval, random=True
    )
)

df_beers_drank = (
    beers_drank.build(withTempView=True)
    .withMetadata("first_name", first_name_metadata)
    .withMetadata("brewery_beer", brewery_beer_metadata)
    .withMetadata("quantity_pint", quantity_pint_metadata)
    .withMetadata("timestamp", timestamp_metadata)
    .withColumn("last_updated", current_timestamp())
    .withMetadata("last_updated", last_updated_metadata)
)

print("Here is the metadata for the fields:")
for field in df_beers_drank.schema:
    print(field.name, field.dataType, field.metadata["description"])

display(df_beers_drank.limit(10))
Basic Querying Dataframes
You can print schema of a dataframe like this.
df_beers_drank.printSchema()
You can show the data using this command and using the parameters to display the data as you wish.
df_beers_drank.show(n=5,Truncate=False)
The display function makes a nicer output than show.
display(df_beers_drank)
You can look at summary statistics on a dataframe using summary().
df_beers_drank.summary().show()
You can use the spark sql context to write sql to display data in python.
display(spark.sql("SELECT * FROM beers_drank LIMIT 10"))
You can use magic commands to run SQL.
%sql
SELECT
  brewery_beer,
  sum(quantity_pint) AS pints_drank
FROM
  beers_drank
GROUP BY
  brewery_beer
You can select columns from dataframes in three different ways and filter.
df_select = df_beers_drank.select(
    col("first_name"), df_beers_drank.brewery_beer, "timestamp"
).filter(col("quantity_pint") == 1)
display(df_select)
You can have a look at a query plan by using explain().
df_select.explain()
You can aggregate data by grouping by different columns using groupBy and Agg. You can also use multiple filters with & (and) and | (or).
df_group = (
    df_beers_drank.groupBy(col("brewery_beer"))
    .agg(
        sum(col("quantity_pint")).alias("pints_drank"),
        min(col("timestamp")).alias("earliest_date"),
    )
    .filter(
        (
            col("brewery_beer").contains("crafty")
            | col("brewery_beer").contains("flower")
        )
    )
)
display(df_group)
You can select distinct values and sort using distinct() and orderBy.
df_sort1 = (
    df_beers_drank.select(col("first_name")).distinct().orderBy(col("first_name").asc())
)
display(df_sort1)
You can select specific distinct values and sort using dropDuplicates and sort.
df_sort2 = (
    df_beers_drank.select("brewery_beer", "first_name", "quantity_pint")
    .dropDuplicates(["brewery_beer", "quantity_pint"])
    .sort(desc("brewery_beer"))
)
display(df_sort2)
You can drop columns using drop and also add constants using lit.
df_constant = df_beers_drank.drop("last_updated").withColumn("tax",lit(17.5))
display(df_constant)
Reading and Writing
There are multiple file formats you can read and write to, such as csv, parquet and delta.
You can write to csv using different modes such as overwrite…
scratch_file_path = "dbfs:/myscratchpad/"
df_beers_drank.write.mode("overwrite").option("header", "true").csv(
    scratch_file_path + "/csv"
)
You can read from csv with multiple options such as the delimiter and whether there is a header row…
scratch_file_path = "dbfs:/myscratchpad/"
spark.read.option("header", "true").option("inferSchema", "true").option("delimiter", ",").csv(
    scratch_file_path + "/csv"
).show()
You can write to delta using different modes such as overwrite…
scratch_file_path = "dbfs:/myscratchpad/"
df_beers_drank.write.format("delta").mode("overwrite").save(
    scratch_file_path + "/delta"
)
You can read from delta…
scratch_file_path = "dbfs:/myscratchpad/"
spark.read.format("delta").load(scratch_file_path + "/delta").show(truncate=False, n=5)
You can use dbutils here to cleanup your scratch work!
dbutils.fs.rm(scratch_file_path, True)

try:
    dbutils.fs.ls(scratch_file_path)
except:
    print("Good: Data Cleared!")
else:
    raise ("Bad: Data Remains!")
Beyond Basic Querying Dataframes
You cn use collect() to get all rows in a list from the dataframe, then pick a row and a value to the first one.
first_brewer_beer_row = (
    df_beers_drank.select(col("brewery_beer")).distinct().collect()[0]
)
print(f"The first row is {first_brewer_beer_row}")
first_brewer_beer = first_brewer_beer_row[0]
print(f"The first value in the first row is {first_brewer_beer}")
You can use collect_list to get non-unique beers that each person drank.
df_beers_collected = (
    df_beers_drank.groupBy("first_name")
    .agg(collect_list("brewery_beer").alias("brewery_beers_drank"))
    .orderBy("first_name")
)
display(df_beers_collected)
You can use collect_set to get unique beers that each person drank and filter on the array for values it contains.
df_beers_collected = (
    df_beers_drank.groupBy("first_name")
    .agg(collect_set("brewery_beer").alias("unique_beers_drank"))
    .orderBy("first_name")
).filter(array_contains(col("unique_beers_drank"),"tinyrebel_staypuft"))
display(df_beers_collected)
You can split column strings to get their individual values and filter using startsWith.
df_beers_split = (
    df_beers_drank.withColumn("brewer", split(col("brewery_beer"), "_")[0])
    .withColumn("beer", split(col("brewery_beer"), "_")[1])
    .filter(col("brewery_beer").startswith("tinyrebel"))
    .drop("timestamp", "last_updated", "brewery_beer")
)
display(df_beers_split)
Dates and Times
There are a number of built in date and time functions you can use such as date_format, date_add and year. You can also cast column data types.
df_dates = (
    df_beers_drank.withColumn("date_cast", col("timestamp").cast("date"))
    .withColumn("date_format", date_format(col("timestamp"), "dd-MMM-yyyy"))
    .withColumn("date_add", date_add(col("timestamp"), 1))
    .withColumn("year", year(col("timestamp")))
    .withColumn("dayofweek", dayofweek(col("timestamp")))
).select("timestamp", "date_cast", "date_format", "date_add", "year", "dayofweek")
display(df_dates)
Functions
You can create simple functions like this.
import random

def random_beer_reaction():
    reaction = ["bleh!", "tasty!", "woshiss??"]
    i = random.randint(0, 2)
    return reaction[i]

random_beer_reaction()
You can also create them with type hints.
@udf("string")
def random_beer_reaction_tudf(beer: str) -> str:
    reaction = ["bleh!", "tasty!", "woshiss??"]
    i = random.randint(0, 2)
    return reaction[i]
You can also used pandas vectorised functions that you want to use over dataframe series (columns) which can perform much faster.
import pandas as pd
from pyspark.sql.functions import pandas_udf

# We have a integer input/output
@pandas_udf("integer")
def get_beer_cost_vudf(quantity_pint: pd.Series) -> pd.Series:
    return quantity_pint * 4.0
You can then register these functions for use in python and SQL
random_beer_reaction_udf = udf(random_beer_reaction)
spark.udf.register("random_beer_reaction_udf", random_beer_reaction)
spark.udf.register("random_beer_reaction_tudf", random_beer_reaction_tudf)
spark.udf.register("get_beer_cost_vudf", get_beer_cost_vudf)
Here are the functions use in python.
df_reaction = (
    df_beers_drank.withColumn("beer_reaction_udf", random_beer_reaction_udf())
    .withColumn("beer_reaction_tudf", random_beer_reaction_tudf(col("brewery_beer")))
    .withColumn("beer_cost_vudf", get_beer_cost_vudf(col("quantity_pint")))
    .select("brewery_beer", "beer_reaction_udf", "beer_reaction_tudf", "beer_cost_vudf")
)
display(df_reaction)
Here they are used in SQL
%sql
SELECT
  brewery_beer,
  random_beer_reaction_udf() AS random_beer_reaction,
  get_beer_cost_vudf(quantity_pint) as beer_cost
FROM
  beers_drank
RePartioning
You can get the number of partitions in a dataframe using DataFrame.rdd.getNumPartitions().
df_beers_drank.rdd.getNumPartitions()
You can reduce the number of partitions in a dataframe using DataFrame.coalesce(n). This never causes a shuffle and you can only decrease the number of partitions. Data skew may still be an issue after a coalesce because it does not cause a shuffle, but it is quicker.
df_beers_drank_coalesce = df_beers_drank.coalesce(2)
df_beers_drank_coalesce.rdd.getNumPartitions()
You can reduce the number of partitions in a dataframe using DataFrame.repartition(n). This always causes a shuffle and you can only increase the number of partitions.
df_beers_drank_repartition = df_beers_drank.repartition(8)
df_beers_drank_repartition.rdd.getNumPartitions()
Caching
You can cache data in spark too. The caching only occurs once you have performed an action.
df_beers_drank.cache()
df_beers_drank.count()
It is not often a good idea to cache data though as it can take up a lot of memory on the cluster. You can remove the cache by calling unpersist.
df_beers_drank.unpersist()